Data Capacity and Performance
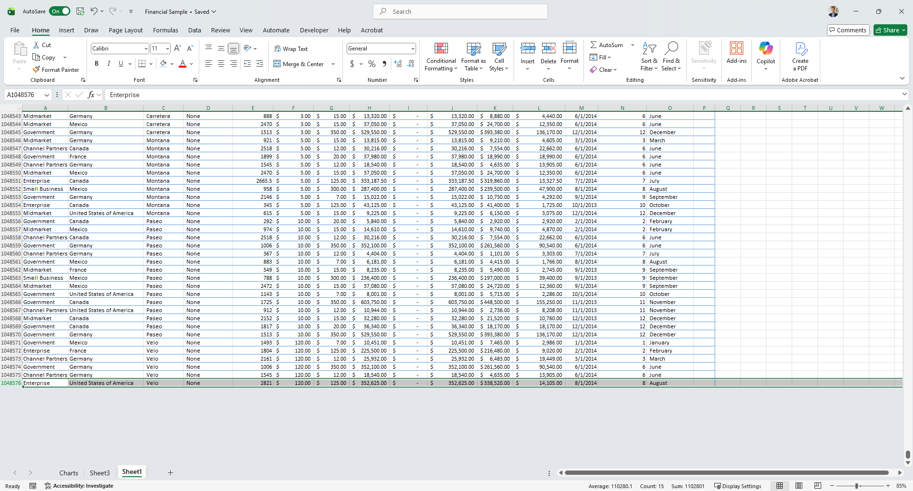
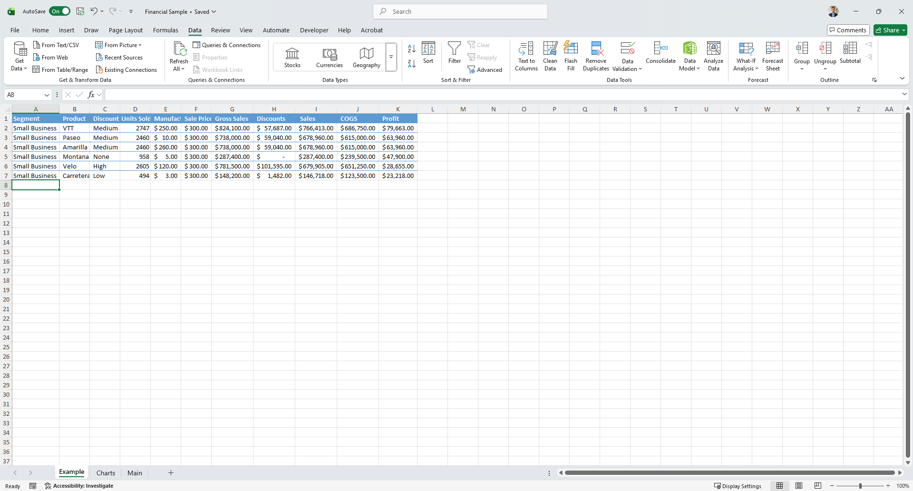
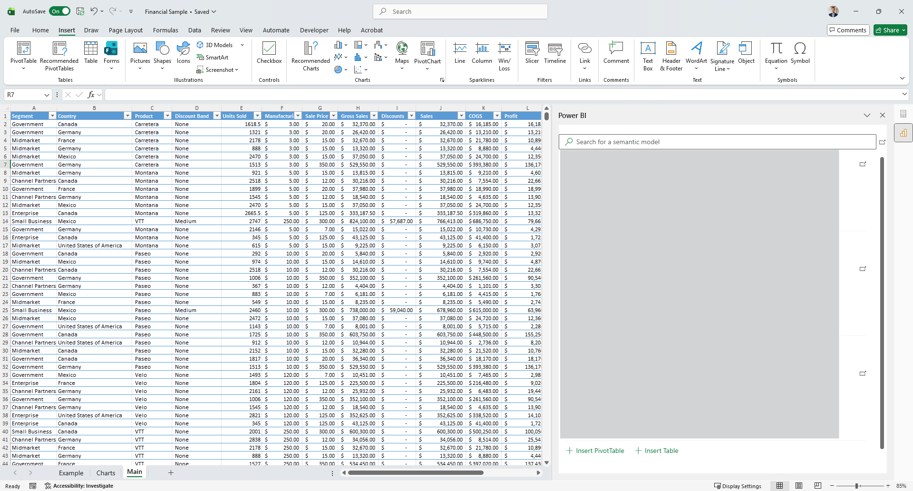
Excel hits a hard ceiling at 1,048,576 rows per worksheet. This limit reflects the constraints of its row-oriented, cell-based architecture. Files approaching this limit slow down, crash frequently, and risk corruption.
Power BI removes capacity constraints through columnar compression. The VertiPaq engine stores data by column rather than row, applying dictionary encoding and run-length encoding to achieve 10x to 20x compression ratios.
A 10 GB CSV file compresses into a 1 GB Power BI semantic model. This architectural difference enables analysis of datasets that would be physically impossible to open in Excel.
Three storage modes address different needs:
Import Mode loads compressed data into memory for fast querying. Suitable for most reporting scenarios with datasets under billions of rows.
DirectQuery sends live queries to source databases without importing data. Enables analysis of petabyte-scale warehouses while maintaining real-time currency.
Direct Lake (Fabric only) reads data directly from OneLake storage without import or query translation. Combines the performance of Import with the freshness of DirectQuery. Direct Lake has expanded through 2025, including support for mirrored Azure Databricks catalogs and combining tables from multiple sources in Power BI Desktop.
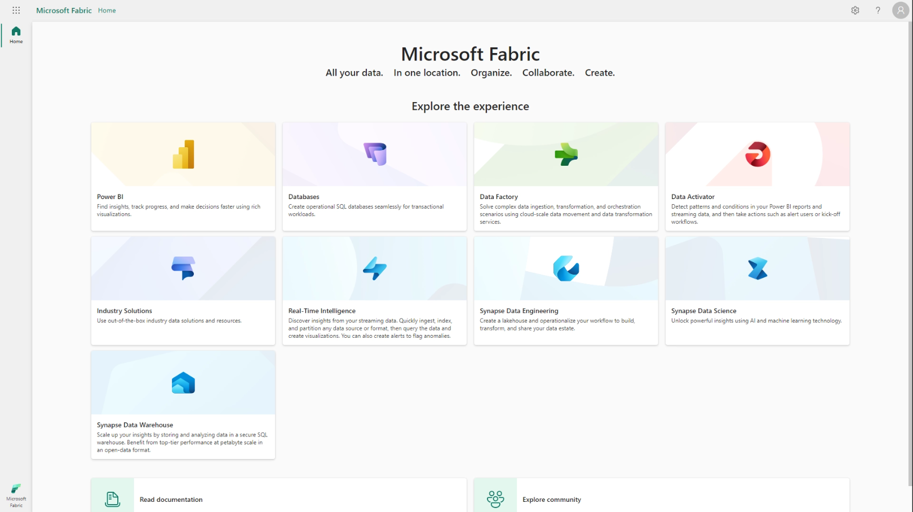
View the difference between Microsoft Fabric vs Power BI
Data Modeling and Calculations
Excel thinks in coordinates. Formulas reference specific cells using spatial logic. "Take the value two columns left and multiply by the header row value."
Power BI thinks in relationships. Logic operates on tables and columns through defined connections. "Sum the Amount column in Sales, filtered by relationships to Calendar and Product."
This mental shift challenges analysts transitioning between tools. Excel users build wide, flat tables containing every data point. Power BI developers design star schemas separating facts from dimensions.
DAX introduces filter context that Excel formulas lack. A single DAX measure dynamically recalculates based on user interactions. Click a region in a slicer and every calculation updates for that filtered context.
Excel requires separate formulas for each scenario. Power BI's context-aware measures replace thousands of static Excel cells with intelligent, adaptive calculations.
Visualization and Interactivity
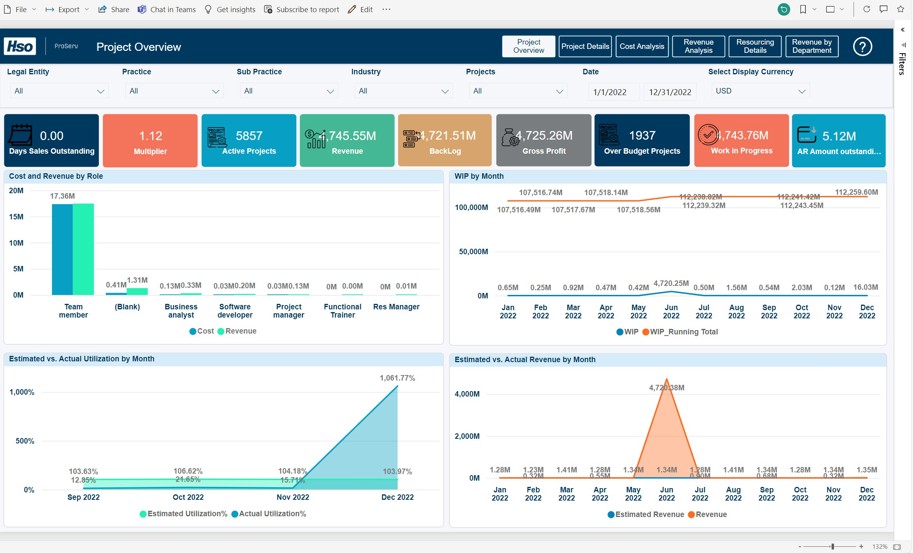
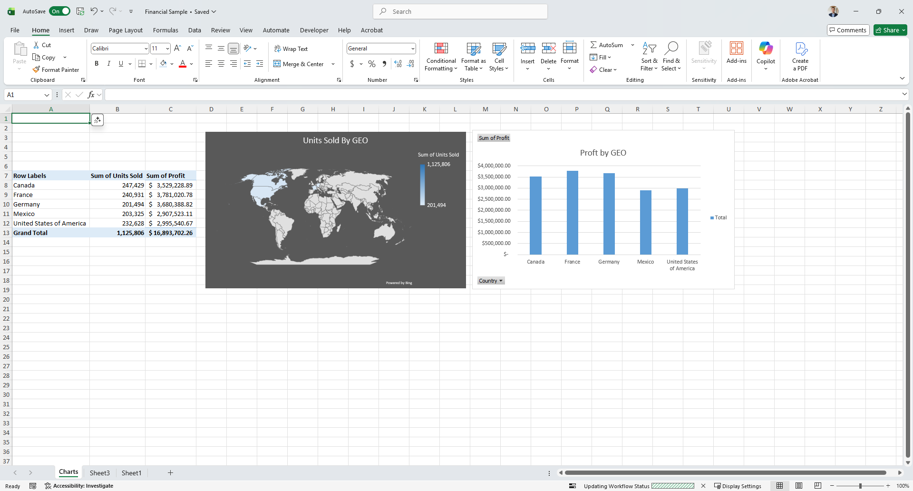
Excel charts display data statically. Users view the visual representation but interact minimally beyond basic tooltips and data labels.
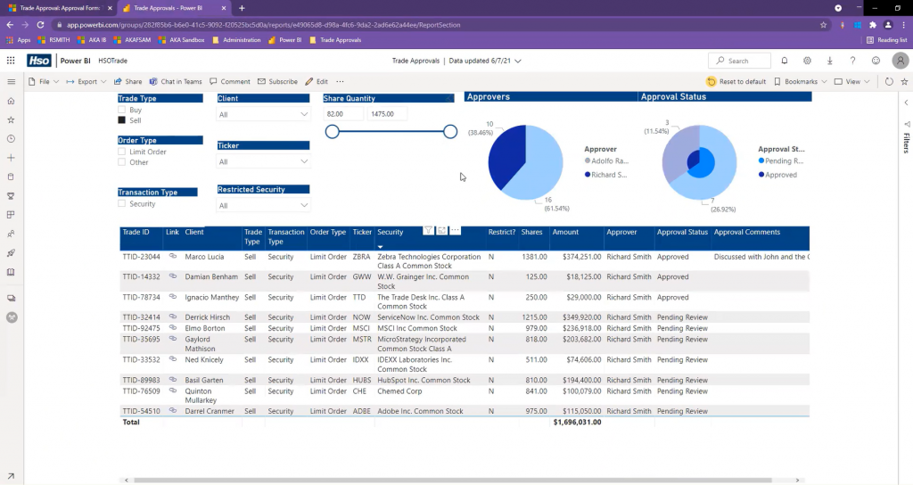
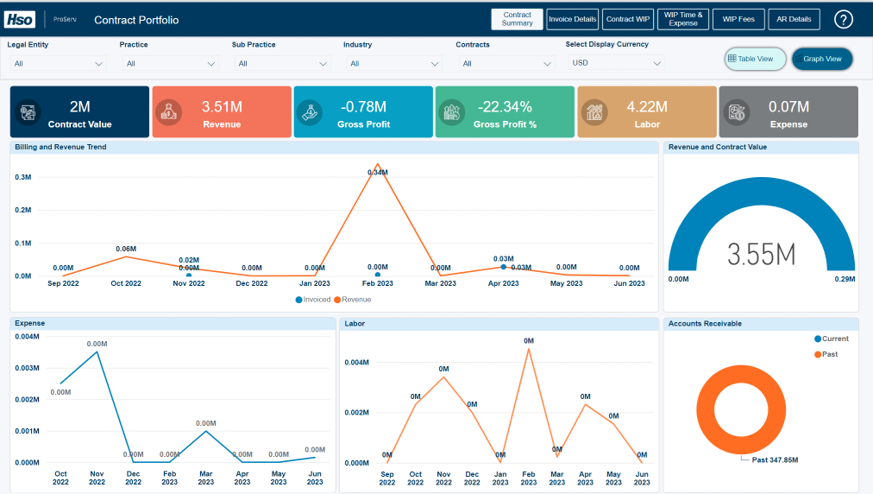
Power BI visuals function as interactive filters. Click a bar in a column chart and every other visual on the page instantly highlights or filters to that selection.
Cross-filtering enables exploratory analysis. Users answer follow-up questions themselves without requesting new reports. "Sales dropped in Q3... let me click Q3... I see it's driven by the Accessories category in the West region."
Drill-through capabilities reveal detail on demand. Right-click any data point to jump to a detailed transaction view, maintaining filter context from the summary page.
Custom visuals extend Power BI beyond standard charts. The AppSource marketplace offers specialized visualizations for industries, use cases, and analytical methods that Excel cannot replicate without extensive workarounds.
Automation, Sharing, and Governance
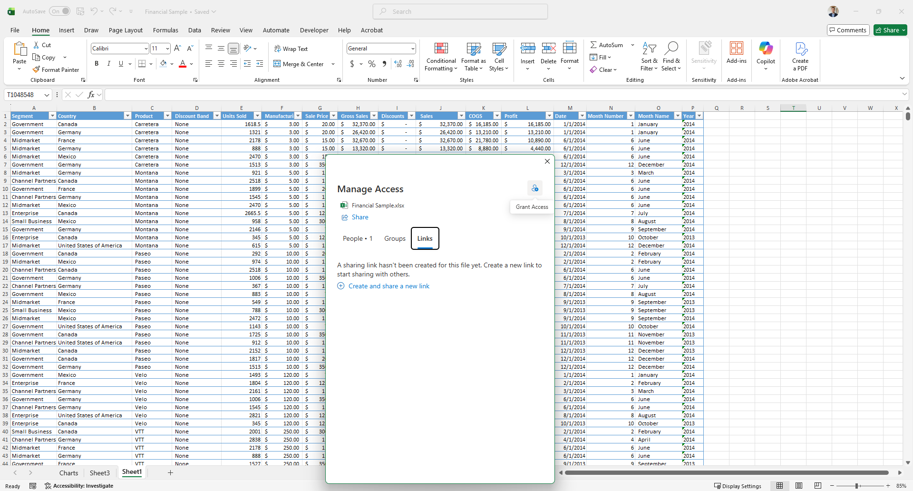
Excel operates as a file. Distribution happens through email attachments or shared network folders. This model creates version conflicts, data staleness, and security risks if not done correctly.
The moment someone emails an Excel report, the data inside becomes obsolete. Corrections made to source systems never reach distributed copies.
Power BI operates as a service. Reports live in the cloud. Users access the same single source of truth through web browsers, mobile apps, or embedded experiences in Teams and SharePoint.
Scheduled refresh keeps data current without manual intervention. Set refresh frequencies from hourly to near real-time based on business requirements and licensing.
Row-level security enforces data access policies centrally. Define roles once. Every user sees only the data their permissions allow, eliminating the need to create separate files for different audiences.
Deployment pipelines support development, testing, and production environments. Changes move through controlled promotion paths rather than direct edits to production files.
Cost, Licensing, and Scalability
Excel licensing comes included with Microsoft 365 subscriptions. This makes it effectively free for organizations already using Office applications.
Power BI licensing follows a tiered model:
Power BI Pro costs $14 per user per month. Both report creators and consumers need Pro licenses to share and view content in shared workspaces.
Premium Per User costs $24 per user per month. Provides advanced features like larger model sizes, more frequent refreshes, and AI capabilities. Content remains in a "walled garden" viewable only by other Premium Per User license holders.
Fabric Capacity (F-SKUs) shifts to consumption-based pricing. The F64 capacity enables unlimited free viewers. Users with basic free licenses can view reports hosted on F64 or higher capacity without Pro licenses.
This capacity model becomes cost-effective for organizations with 500+ users. Paying $14 monthly for thousands of passive report viewers is economically inefficient compared to capacity licensing.
License Tier | Typical Cost (Per User/Month) | Core Functionality & Use Case |
|---|
Excel (via M365) | Effectively free (included in Microsoft 365/Office 365 licenses) | General-purpose spreadsheet tool for data organization, analysis, and reporting. Ideal for ad-hoc analysis, simple reporting, and detailed data entry. |
Fabric (Free) | Free | Allows users to connect to data and create reports and dashboards for their own use. Also includes the Power BI Desktop app for developing reports. |
Power BI Pro | $14.00 per user/month, paid yearly | Standard license for self-service BI; allows users to create, read, publish, and interact with content. Required for sharing and collaboration with other Pro users in shared capacity. |
Premium Per User (PPU) | $24.00 per user/month, paid yearly | Includes all Pro capabilities plus most Premium capacity features. License-specific users with enterprise-scale features. |
Premium Capacity | Fabric Capacity (F-SKUs) | Consumption-based capacity for larger organizations. Enables enterprise-scale analytics and lets free users view content at F64 and above without individual licenses. Note: the older Premium per-capacity P-SKUs are being phased out, with customers moving to Fabric F-SKUs at renewal. |
View the latest Power BI Pricing here. (Accurate as of June 2026)