Learn more about our Financial Services solutions
Video: Meeting My Targets and Goals as a Credit Union Commercial Relationship Manager with Microsoft Dynamics 365 and Actionable Insights
Actionable Insights allows credit union commercial relationship managers to track activities and pipeline for more opportunities

How commercial relationship managers meet their targets and goals with actionable insights
Personal Dashboard
Today, we’re going to demonstrate how commercial relationship managers at a credit union can keep on track of activities and pipeline. We’re going to first start with my personal dashboard.
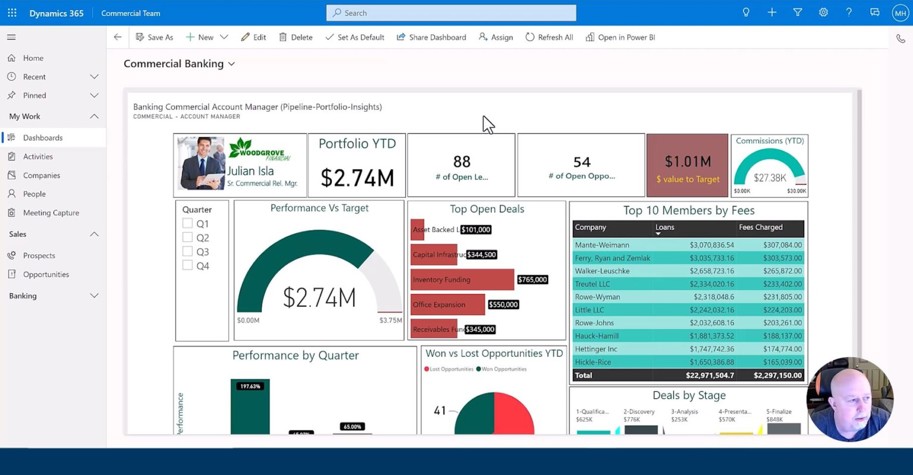
Here is a list of all my opportunities.
I can track and understand what my portfolio looks like year to date, tracking leads and the value of those leads, open opportunities, and the value of those open opportunities and where to target, not only from a total revenue perspective, but also a commission’s perspective.

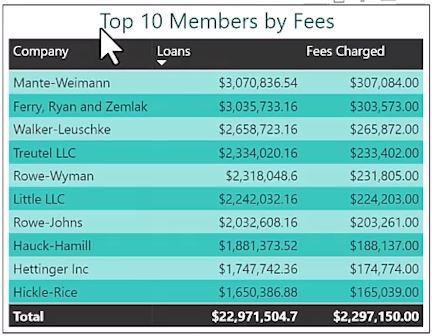
Here’s a list of my top 10 members. Those are the ones that are bringing the most business to the credit union.
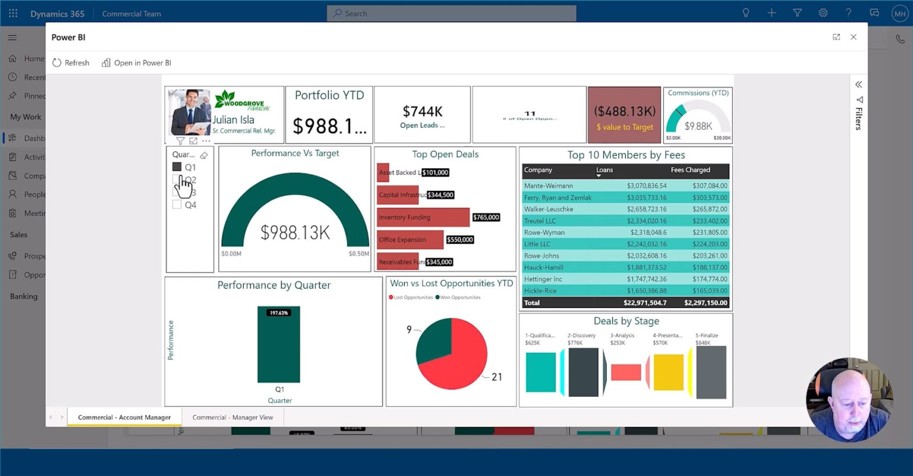
I can see historical dating, look back over times I click on these, the data will change, reflect each of my quarterly goals and objectives and whether I met them.
Manager Dashboard
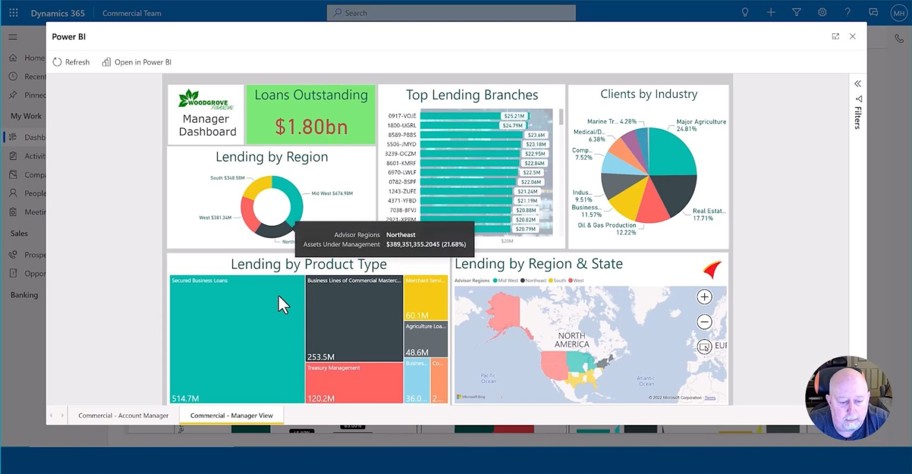
As a bonus, if I happen to be a manager, we can see a roll up of multiple branches. In this case, I see total loans outstanding, where they are by region, by product type on the geographic map, and then also what are the top branches and who’s doing the best. Finally, a nice little breakdown by industry. So we see that real estate and major agriculture are the largest loans that we work with in our portfolio.
Active Companies Dashboard
Let’s look at another dashboard here that has a list of some of my meetings and activities. These are a couple firms that will be coming in so that we can hopefully help them with some financial products. But you’ll see that I’ve got several other ones. I also have smart assistant or smart software, which is used to help prevent things from falling through the cracks.
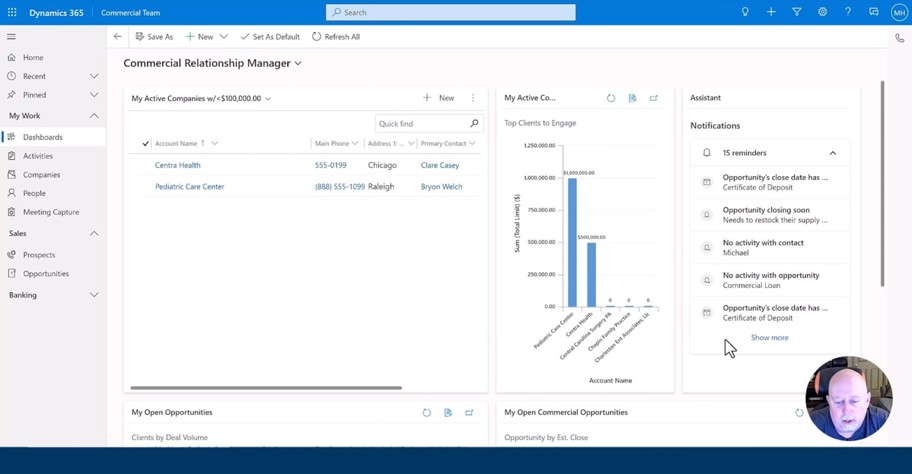
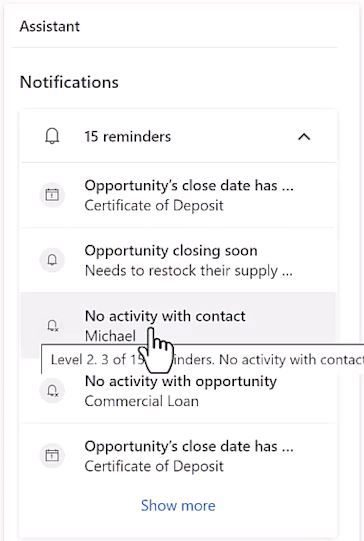
As you can see, I’ve got some opportunities closing, as well as I haven’t had any touches with some of my clients in a while. So, it’s reminding me of that. I want to stay on top of those activities.
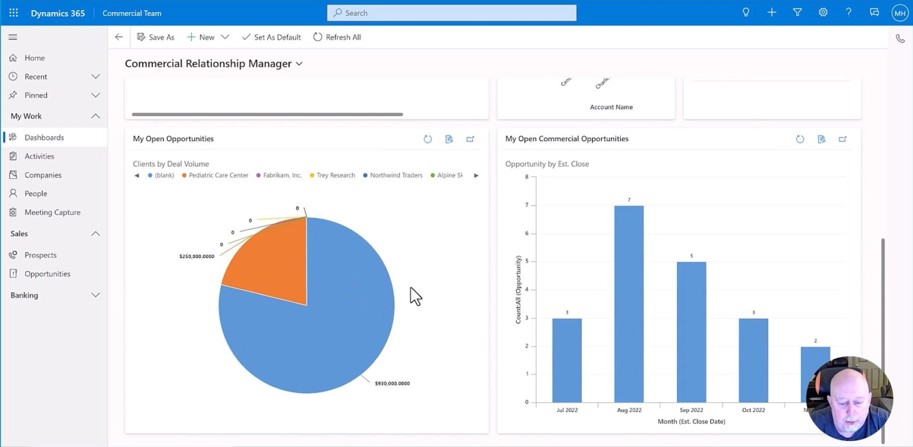
As we scroll down, we’ll see the different opportunity types and then my pipeline over time.
Drill-Down View of Customer
This area of the dashboard can really help me stay focused and understand what a client’s needs are. I’m going to jump into the Pediatric Care view. Now, I’m presented with a 360-degree view of just that particular member details.
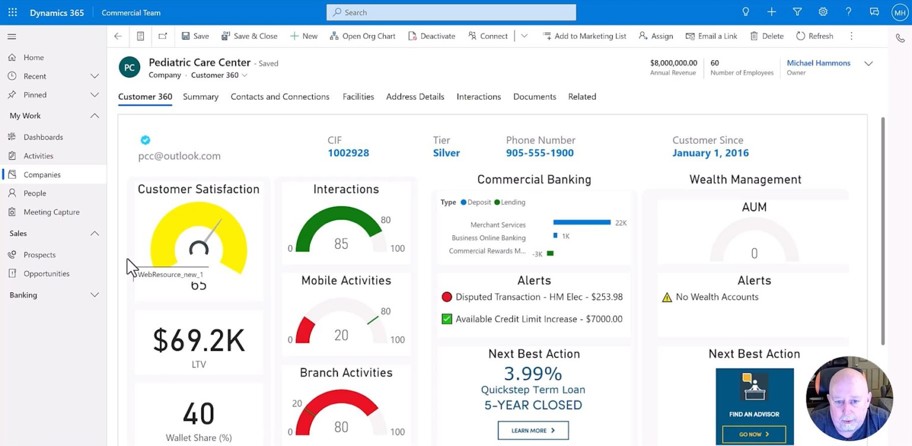
We see customer satisfaction scores, we see lifetime revenue and value, our estimated wallet share, number of interactions that we’ve had in total. Are they doing banking activities? Are they coming into the branches, how often? We see their products and services and values of those.
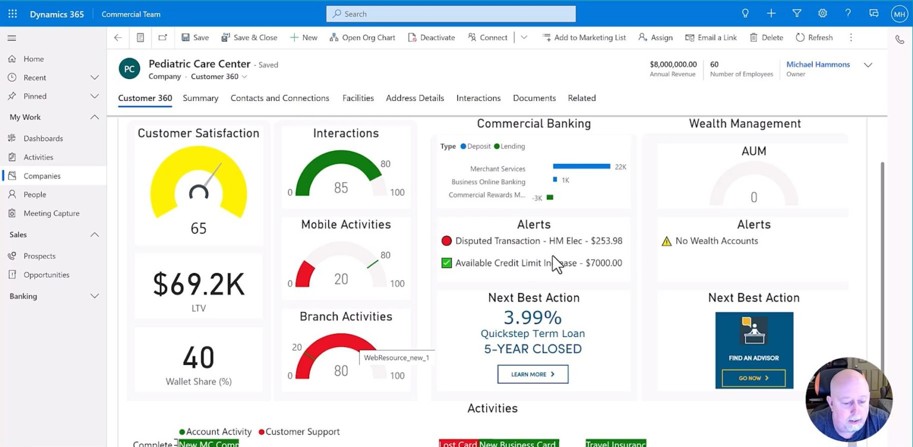
We even see alerts. As a result, we see that there was a disputed transaction, as well as a recent credit increase.
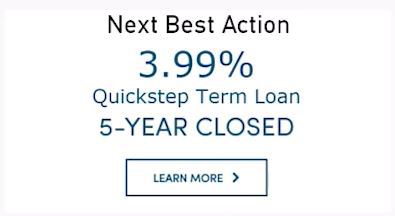
Next Best Action
I can see these things over time as well, but even more importantly, I can see next best action, which is there to really help me have a discussion with that member to offer them this product based upon analysis of their data and their previous transactions. I also can see into the wealth management side of things, and in this case, we’re not doing any wealth opportunities with the owners of Pediatric Care Center. So might be a good one to have a discussion with next time we see them.
