Apart from factoring in lost sales, what else can you do to improve forecast accuracy? There are a number of approaches you can use in combination:

Managing Demand Not Sales
Most retailers focus on managing sales when they should focus on managing demand first. If you offer a 95% in-stock service level the following formula holds true:
Sales = 95% * Demand
Hence growing sales is a combination of focusing on two things:
- Growing demand
- Setting the most appropriate target service levels and then managing the inventory to achieve them.
This article focuses on demand. A good place to start is:
Demand = Sales + Lost Sales
Every retailer has lost sales mostly caused by out of stocks in stores or the warehouses. In one sense, these are the easiest sales to recover, because you don’t have to win them from competition.
The customer was going to buy from you already, it’s just that your stock management failed them. You just have to minimize out of stocks and you do this by factoring the lost sales into your sales planning and forecasting.
The second thing to appreciate is that demand is demand at a price. As a sweeping generalisation, if you reduce the price of something, you mostly sell more. So let us examine these two aspects of demand in more detail.
Watch video Same-day Click & Collect
Discover existing capabilities and recent product enhancements that help retailers facilitate a comprehensive Buy-Online, pick-up In-Store order processing flow with Dynamics 365 Commerce.


1. Demand Rather than Sales
Lost sales in retail ranges from about 6% of sales in grocery to more than 20% in fashion apparel. This range is so wide because grocery forecasting errors are smaller, as almost all products are continuity items and have a lot of sales history. This allows advanced forecasting models to achieve greater forecast accuracy. In fashion, a good line may sell one SKU a week in a store and you often only have this season’s history, so you get much higher forecast errors.
With lost sales in this kind of range, if you could reduce your lost sales by half, this would be a 10% sales increase in fashion and a 3% sales increase in grocery sales. In many years, you would be delighted if your comp store sales (same store sales) were that good. Hence it is worth making a serious effort.
The first step in the journey is to capture daily out of stocks by store by SKU. In practice, when you estimate demand using sales plus lost sales, you may reduce the theoretical lost sales number by a factor (often 50%), as some customers experiencing an out of stock will buy a substitute instead.

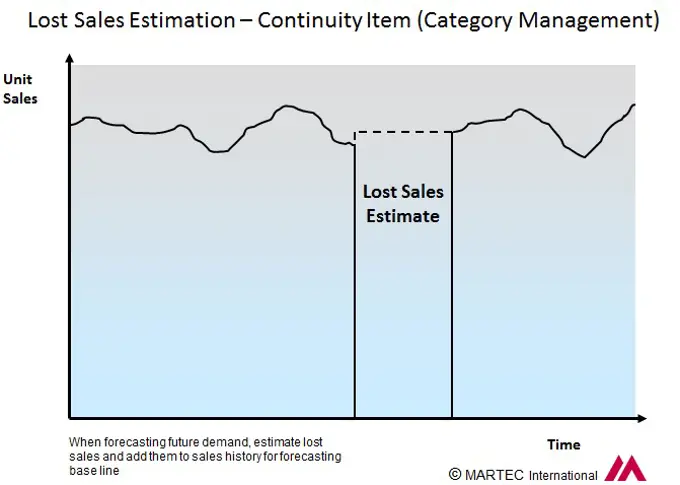
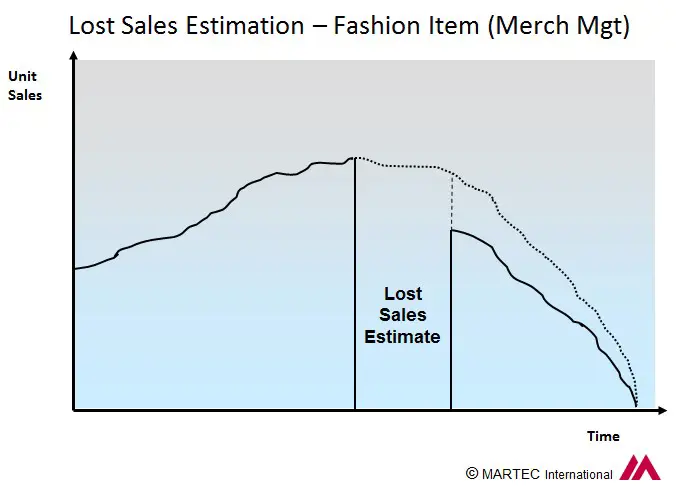
The two charts above show how to estimate lost sales in a continuity product situation and a seasonal product situation. With continuity products, sales drop when a stockout occurs but they recover when the product is back in stock. With seasonal product though, if a stockout lasts for any period of time, the shopper assumes that the line is ended and does not come back looking for it. Hence when the product is back in stock sales never recover to previous levels.
Watch video Product Recommendations
Watch how Dynamics 365 Commerce can be used to show product recommendations on the e-Commerce website and point of sale (POS) device.

During the trading season, you can mostly only estimate the sales lost during the out of stock period and you have to use that number in your in-season re-forecasting. At the end of the season you can devote more time to an end of season review to learn lessons for next time. Then you can compare the period after the product returned to in stock status to determine the lost sales for the rest of the season by comparing actual sales to an updated version of the plan for that period.
In your database, keep your sales and lost sales numbers separately, as planning and forecasting things like returns can only be based on actual sales rather than demand. The calculation of lost sales is done in units and then multiplied by the prevailing retail price at the time of sale to get a money number. The price also needs to be stored by SKU by time as it will most likely change as things like promotions and clearance actions take place.
- 1
- Forecast at the right level in the merchandise hierarchy. Forecasting at store SKU has very high error rates. Some surveys have found an average error of 50%. Much better is to forecast at warehouse despatch level using the aggregate of demand from all the stores served by that warehouse. In order to replenish individual stores, you will then need a good allocation process.
- 2
Most stores carry a certain number of weeks sales as their inventory level. A fashion retailer might have 8 weeks sales in store, for example. If you forecast a rolling 8 weeks, at store SKU, the forecast will be more accurate as some of the weekly plus and minus errors will cancel out.
- 3
There are times when the recent history is of little use. An example is during the Covid store lockdowns. In these circumstances, it is best to go back to an earlier year where the history is more “normal” to use as the baseline for demand forecasting. In this case, you apply the lost sales for the year in question to get estimated demand for that historic year. You may then apply a scaling factor to be more representative of this year.
- 4
Modern machine learning based forecasting systems also do a better, more accurate job. These systems use advanced statistical techniques like regression analysis. They include a variety of other factors in addition to demand history to adjust for differences, such as promotional calendar changes, weather, holidays and so on.
Demand at a Price
Most products have a price elasticity. This means that as the price falls, sales increase. The image below shows an example of a price elasticity graph.
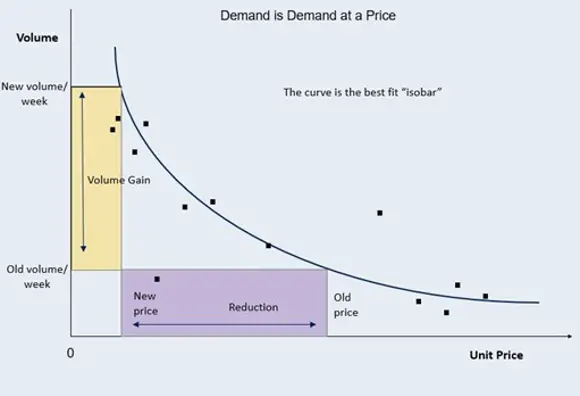
All products have an initial retail price which is the price it first goes on sale at when it arrives in the stores. The gross margin this price gives is known as the intake margin or initial margin or receipt margin. Periodically, the product may be reduced in price as part of a promotion. If so, it will return to its regular price when the promotion ends. If it is a seasonal product, say a spring summer product, and it does not achieve its planned sell through, it will be marked down at some point in the season. Precisely when this happens will depend on how badly it is missing its sell through plan. Clearance markdowns like these go down and may go down again. They never go up.
As prices are reduced to make sales increase, an eye must be kept on the achieved gross margin to make sure that the benefits of the sales increase in units are not wiped out by the reduction in gross margin. In branded goods, the brand owner may contribute to the markdown cost, but this does not happen with private label or own brand goods.
If a product is in short supply, you can use the price elasticity curve to reduce demand to more nearly match the supply available. Grocers do this naturally with categories like fruit and vegetables. The higher retail price will help protect money sales even though you can’t sell the same number of units. In non-food, the best time to adopt this approach is before the season starts, if you know that supply will be limited. Customers will be more resistant if you change the price upwards in season.
This chart shows a sales profile and the sales in each time period are expressed as a percentage of the sales for the whole season (which may include sales into the first few weeks of the next season to clear carry over stock). The shape of the curve is the important thing and you may adjust the shape of the curve to reflect a different promotional calendar or other important change.
As before, this profile should be based on estimated demand not actual sales. An example is Easter, which moves the week in which it occurs every year. If you know that Easter will be 2 weeks later next year, you can move the Easter week percentage later by two weeks and make last year’s Easter week a more normal percentage for that time of year.
This process can be improved if you have a rigorous approach to assigning attributes to products. ideally, you should assign product attributes to each new product as you create them in your systems. Attributes can include things like:
- Price
- Silhouette or product shape
- Skirt length
- Cuffs (turnups) or no cuffs on trousers
- Double or single cuffs on shirts
- Wear with cufflinks
- Fabric composition
- Fabric treatments like wrinkle free
- Colour
- Fit
- Flavour
- Type of wood in cabinet furniture
The list does not need to be lengthy for each individual product but should include those likely to be most important. You can then use a balanced scorecard approach to calculate a weighted average attribute score for each product and select the product with the score closest to that for the new product.
The higher the score, the better the historic product serves as a guide. Having set up attributes, you can run some trial calculations on your history to find out which attributes are most significant in any one product category.
The other approach if you have rigorous attribute definitions is to calculate the balanced scorecard as above, take the seasonal total for the most representative product and use the demand history for that specific product to create a sales profile. This could introduce bigger week by week errors though, as developing the profile shape at higher levels in the hierarchy smooths out some of the random noise in the data.
Using these process variants in suitable combinations and supported by appropriate software will greatly reduce forecast errors and this in turn will result in higher sales in both units and money.

Help your customers spread the cost of the purchase
In the current climate, customers might not have as much disposable income as they had before. So one thing we can do to help customers is to allow instalment billing. This will enable us to split the payment for goods over a period of time.
Summary and Conclusions
In this article we have focused on the importance of developing demand plans rather than sales plans and considered how we can use lost sales, promotions and price elasticity to manage demand.
Managing sales then becomes managing demand and managing inventory levels to achieve service level targets.
Modern systems have a huge role to play in this and emerging technologies such as demand forecasting based on machine learning are making rapid progress with many retailers now adopting these techniques.
As stated earlier reducing lost sales by half could be worth a 3% to 10% sales increase depending on industry segment. And remember that almost all the gross margin on these increases drops to the bottom line, so the percentage increase in profits can be much higher.

How can we help you?
Continue reading here...